
Last updated: 17 November 2026 | Data: Department of Enterprise, Tourism and Employment (DETE) employment permit statistics for January to October 2026 (published 9 November 2026), compared with DETE’s 2025 tables. All refusal rates and percentage changes on this page are QuickHireAlert calculations from those official figures.
How many employment permits has Ireland issued in 2026, and who is getting them? DETE publishes monthly tables that break every permit down by the worker’s nationality, the county of employment, the employer’s sector and the employer itself. This page brings those four tables together in one place, compares them with 2025, and explains what the figures do and do not tell someone planning to work in Ireland.
Important: This is general information, not legal or immigration advice. QuickHireAlert is an independent publisher, not a recruiter or a government body. The figures count permits already issued; they do not show current vacancies or your chances in an individual application.
Quick Answer: Ireland Work Permit Numbers in 2026
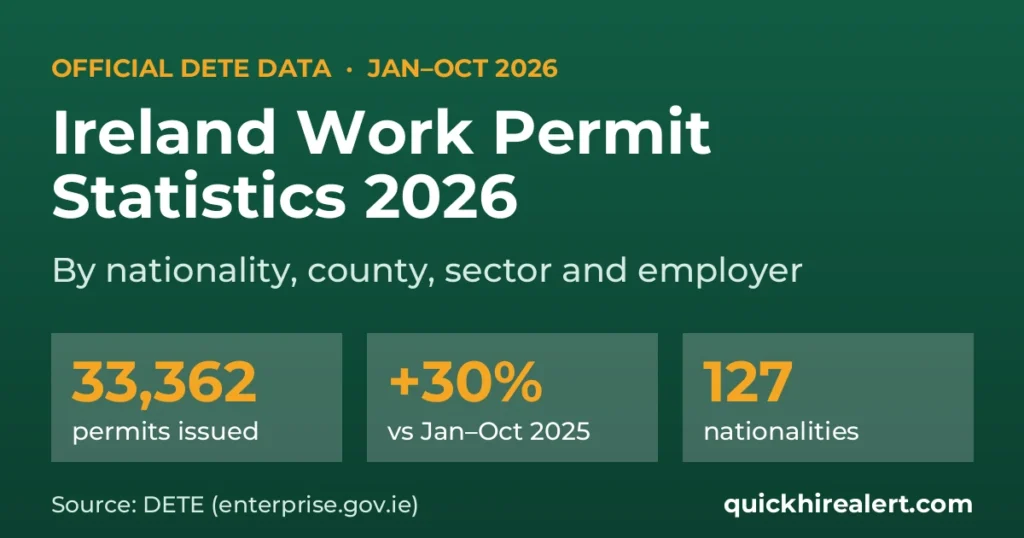
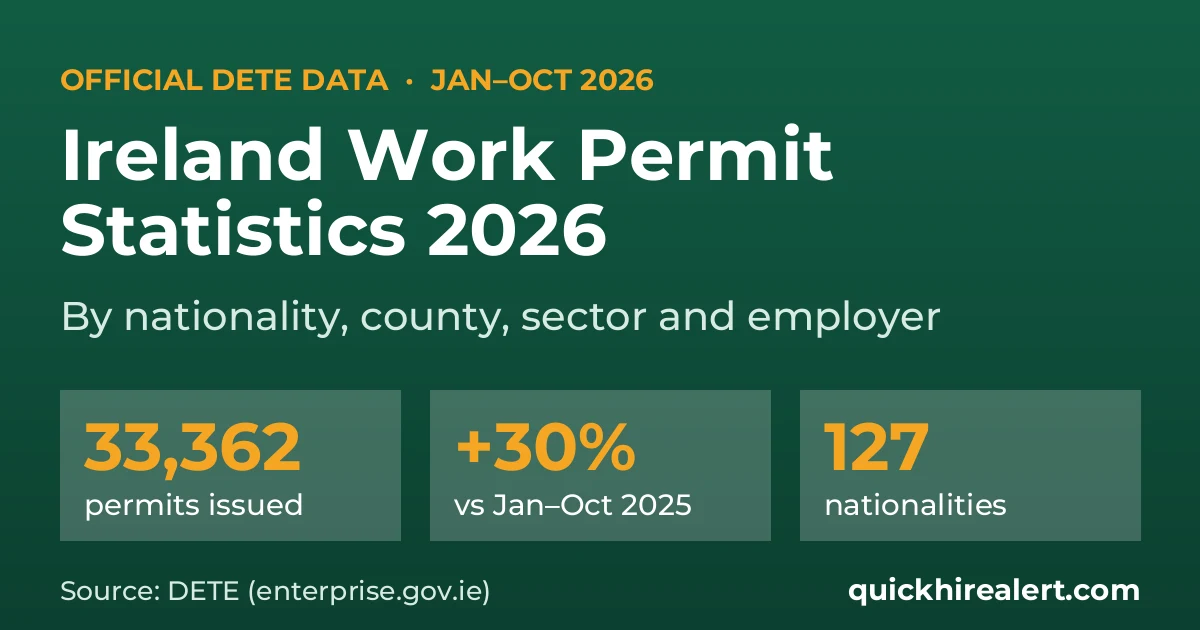
From January to October 2026, DETE issued 33,362 employment permits and refused 3,758 applications. That is already more than the 31,044 permits issued in the whole of 2025, and about 30% more than the 25,715 issued in January to October 2025. Permits went to workers of 127 nationalities, employed by 8,406 different employers.
| Jan–Oct 2026 | Jan–Oct 2025 | Full year 2025 | |
|---|---|---|---|
| Permits issued | 33,362 | 25,715 | 31,044 |
| Permits refused | 3,758 | – | 3,432 |
| Refusal rate (our calculation) | 10.1% | – | 10.0% |
| Nationalities | 127 | – | – |
| Employers issued a permit | 8,406 | – | 8,330 |
Refusal rate = refused ÷ (issued + refused). DETE does not publish a refusal rate; this is our calculation. Monthly 2025 refusal totals were not used, so no January–October 2025 refusal figure is shown.
Key Findings
- A strong recovery. Ten months of 2026 have already passed the full-year 2025 total, with permits up about 30% on the same period last year. 2025 itself was a weaker year: DETE issued 39,390 permits in 2024, so 2026 is recovering towards that level rather than setting a record so far.
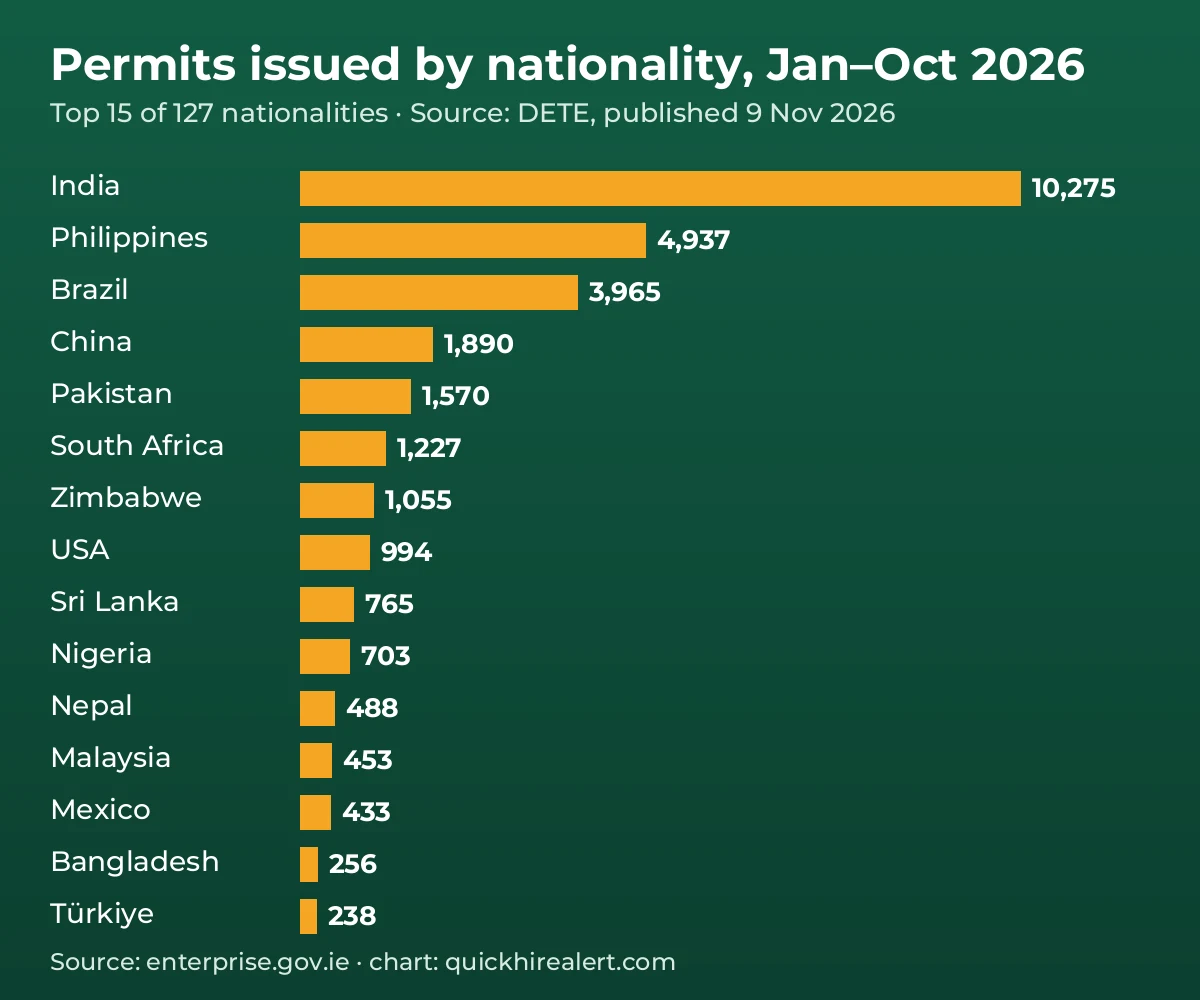
- India leads by a wide margin. Indian nationals received 10,275 permits, or 30.8% of the total. India, the Philippines and Brazil together account for 57.5%.
- The Philippines is growing fastest among large groups. Filipino workers received 4,937 permits in ten months, compared with 3,398 in the whole of 2025.
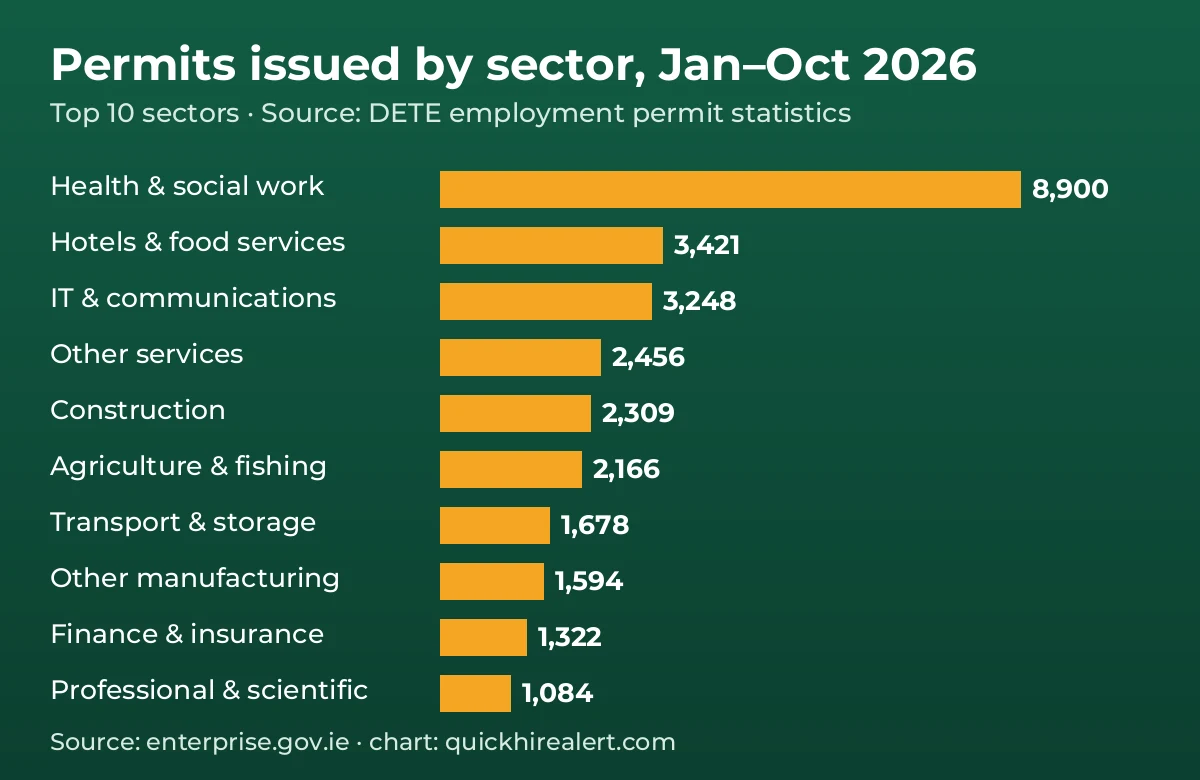
- Healthcare dominates. Health and social work received 8,900 permits (26.7% of the total), up 34.8% on January to October 2025.
- Dublin takes 44%. Dublin employers received 14,695 permits, already slightly above Dublin’s full-year 2025 total of 14,627. Cork is a distant second with 3,348.
- Refusals have risen since 2024. About one decision in ten was a refusal in January to October 2026 (10.1%), the same as in 2025 (10.0%). In 2024 the rate was much lower: DETE issued 39,390 permits and refused 2,456, according to EMN Ireland, a refusal rate of about 5.9% by our calculation.
Ireland Work Permits by Nationality (2026)
The table lists the 25 nationalities that received the most permits from January to October 2026. The 2025 column is the full year, because DETE’s 2025 nationality table is not broken down by month; compare it with care, as it covers twelve months against ten.
| # | Nationality | Issued Jan–Oct 2026 | Refused Jan–Oct 2026 | Refusal rate* | Issued full year 2025 |
|---|---|---|---|---|---|
| 1 | India | 10,275 | 862 | 7.7% | 9,947 |
| 2 | Philippines | 4,937 | 518 | 9.5% | 3,398 |
| 3 | Brazil | 3,965 | 685 | 14.7% | 3,381 |
| 4 | China | 1,890 | 253 | 11.8% | 1,922 |
| 5 | Pakistan | 1,570 | 182 | 10.4% | 1,453 |
| 6 | South Africa | 1,227 | 179 | 12.7% | 1,240 |
| 7 | Zimbabwe | 1,055 | 162 | 13.3% | 831 |
| 8 | United States | 994 | 44 | 4.2% | 1,039 |
| 9 | Sri Lanka | 765 | 69 | 8.3% | 631 |
| 10 | Nigeria | 703 | 94 | 11.8% | 726 |
| 11 | Nepal | 488 | 82 | 14.4% | 425 |
| 12 | Malaysia | 453 | 29 | 6.0% | 503 |
| 13 | Mexico | 433 | 50 | 10.4% | 392 |
| 14 | Bangladesh | 256 | 53 | 17.2% | 203 |
| 15 | Türkiye | 238 | 14 | 5.6% | 332 |
| 16 | Kenya | 209 | 36 | 14.7% | 172 |
| 17 | Chile | 205 | 33 | 13.9% | 185 |
| 18 | Egypt | 205 | 10 | 4.7% | 206 |
| 19 | Canada | 188 | 15 | 7.4% | 232 |
| 20 | Japan | 185 | 4 | 2.1% | 123 |
| 21 | Sudan | 174 | 4 | 2.2% | 185 |
| 22 | Ghana | 157 | 23 | 12.8% | 153 |
| 23 | Ukraine | 150 | 11 | 6.8% | 185 |
| 24 | Israel | 143 | 0 | 0.0% | 156 |
| 25 | Australia | 132 | 6 | 4.3% | 120 |
*Refusal rate is our calculation: refused ÷ (issued + refused). Small numbers can produce large swings in the rate.
Refusal rates vary widely by nationality. Among the larger groups, US (4.2%) and Indian (7.7%) applicants saw the lowest rates, while Brazilian (14.7%), Nepali (14.4%) and Bangladeshi (17.2%) applicants saw the highest. DETE assesses each application against criteria such as the occupation lists, salary thresholds, the labour market needs test where it applies, and the documents supplied; the table does not show why individual applications were refused. Country guides: jobs in Ireland for Indians and jobs in Ireland for Pakistani applicants (Pakistan received 1,570 permits in ten months, against 1,453 in all of 2025).
Ireland Work Permits by County (2026)
The county is where the employment is based, not where the worker lives. Outside Dublin, employers received 18,667 permits in ten months of 2026, compared with 16,417 in the whole of 2025.
| County | Issued Jan–Oct 2026 | Refused Jan–Oct 2026 | Share of 2026 total | Issued full year 2025 |
|---|---|---|---|---|
| Dublin | 14,695 | 1,509 | 44.0% | 14,627 |
| Cork | 3,348 | 436 | 10.0% | 2,973 |
| Kildare | 1,616 | 184 | 4.8% | 1,194 |
| Meath | 1,495 | 137 | 4.5% | 1,252 |
| Limerick | 1,454 | 186 | 4.4% | 1,543 |
| Galway | 1,367 | 200 | 4.1% | 1,104 |
| Waterford | 896 | 63 | 2.7% | 695 |
| Wexford | 869 | 85 | 2.6% | 762 |
| Kerry | 773 | 44 | 2.3% | 527 |
| Clare | 750 | 75 | 2.2% | 538 |
| Tipperary | 674 | 80 | 2.0% | 650 |
| Louth | 669 | 53 | 2.0% | 511 |
| Donegal | 480 | 51 | 1.4% | 488 |
| Wicklow | 476 | 78 | 1.4% | 390 |
| Kilkenny | 463 | 76 | 1.4% | 580 |
| Cavan | 461 | 91 | 1.4% | 501 |
| Offaly | 456 | 57 | 1.4% | 358 |
| Westmeath | 446 | 68 | 1.3% | 457 |
| Mayo | 414 | 67 | 1.2% | 383 |
| Monaghan | 360 | 51 | 1.1% | 449 |
| Sligo | 283 | 33 | 0.8% | 218 |
| Roscommon | 237 | 35 | 0.7% | 188 |
| Laois | 233 | 28 | 0.7% | 229 |
| Carlow | 201 | 38 | 0.6% | 181 |
| Longford | 143 | 25 | 0.4% | 147 |
| Leitrim | 103 | 7 | 0.3% | 99 |
DETE’s 2026 county table also contains one refusal recorded under County Down, with no permits issued; it is left out of this table.
Ireland Work Permits by Sector (2026)
DETE’s sector table is monthly for both years, so this is a like-for-like comparison of January to October 2026 with January to October 2025.
| Sector | Jan–Oct 2026 | Jan–Oct 2025 | Change* |
|---|---|---|---|
| Health & Social Work Activities | 8,900 | 6,603 | +34.8% |
| Accommodation & Food Services Activities | 3,421 | 2,877 | +18.9% |
| Information & Communication Activities | 3,248 | 2,977 | +9.1% |
| Other Service Activities | 2,456 | 1,718 | +43.0% |
| Construction | 2,309 | 1,692 | +36.5% |
| Agriculture, Forestry & Fishing | 2,166 | 1,654 | +31.0% |
| Transport & Storage | 1,678 | 1,160 | +44.7% |
| All Other Manufacturing | 1,594 | 1,053 | +51.4% |
| Financial & Insurance Activities | 1,322 | 1,129 | +17.1% |
| All other Professional, Scientific & Technical Activities | 1,084 | 576 | +88.2% |
| Manufacture of Food, Drink & Tobacco | 917 | 441 | +107.9% |
| Professional, Scientific & Technical Activities of Head Offices, Management Consultancy Services | 755 | 643 | +17.4% |
| Wholesale & Retail Trade | 738 | 483 | +52.8% |
| Manufacture of Chemicals & Pharmaceuticals | 465 | 496 | -6.3% |
| Arts, Entertainment and Recreation | 465 | 543 | -14.4% |
| Education | 454 | 371 | +22.4% |
| Manufacture of Computers, Electronics & Optical Equipment | 368 | 353 | +4.2% |
| Electricity & Gas & Air Conditioning Supply | 339 | 304 | +11.5% |
| Manufacture of Medical Devices | 206 | 221 | -6.8% |
| Administrative & Support Service Activities | 179 | 78 | +129.5% |
| Mining & Quarrying | 132 | 91 | +45.1% |
| Water Supply – Sewerage Waste Management & Remedial Activities | 90 | 72 | +25.0% |
| Real Estate Activities | 39 | 34 | +14.7% |
| Public Administration & Defence | 28 | 45 | -37.8% |
| Domestic – Activities of Households as Employers | 7 | 6 | +16.7% |
*Our calculation. DETE also records a small number of permits with no sector entered (2 in 2026, 95 in January to October 2025); these are excluded from the table.
The biggest sectors all grew. Health and social work rose 34.8%, construction 36.5%, transport and storage 44.7%, and agriculture, forestry and fishing 31.0%. Food and drink manufacturing more than doubled (917 against 441). Information and communication grew more slowly (+9.1%), while chemicals and pharmaceuticals (−6.3%), medical devices (−6.8%) and arts and entertainment (−14.4%) fell. For the roles that qualify for a permit, see the Ireland occupation shortage list.
Employers That Received the Most Permits (2026)
| # | Employer (as named by DETE) | Permits issued Jan–Oct 2026 |
|---|---|---|
| 1 | Dawn Meats Ireland UC | 293 |
| 2 | Google Ireland Limited | 270 |
| 3 | Redwood Extended Care Facility Unlimited Company | 246 |
| 4 | Resilience Healthcare Limited | 242 |
| 5 | Costern Unlimited Company | 238 |
| 6 | Rosderra Irish Meats Group Unlimited Company | 238 |
| 7 | Applus Inspection Services Ireland Limited | 196 |
| 8 | Cork University Hospital | 187 |
| 9 | University Limerick Hospitals Group | 178 |
| 10 | Tata Consultancy Services Limited | 170 |
| 11 | Allpro Security Services Ireland Limited | 168 |
| 12 | Ernst & Young | 161 |
| 13 | Accenture Limited | 147 |
| 14 | Bus Átha Cliath – Dublin Bus | 146 |
| 15 | Mowlam Healthcare Services Unlimited Company | 141 |
Permits are spread thinly: 8,406 employers received at least one permit, and the top employer, Dawn Meats Ireland, received 293. Meat processing, nursing homes and home care, hospitals, technology and consultancy firms dominate the top of the list. For the full ranking, groups that appear under several company names, and how to check whether an employer is hiring now, see companies that received Irish employment permits. Appearing on DETE’s list does not mean a company is hiring or will sponsor any particular applicant.
What These Numbers Mean if You Want to Work in Ireland
- Demand is real, but sector-specific. Healthcare, hospitality, technology, construction, agriculture and transport account for most permits. A job offer in an eligible occupation, at or above the salary threshold, is still the starting point. See jobs in Ireland with visa sponsorship.
- Look beyond Dublin. More than half of all permits went to employers outside Dublin, and several counties, including Kildare, Kerry, Clare and Galway, are well ahead of their 2025 pace.
- Applications are refused for fixable reasons. About 10% of decisions were refusals. Check the occupation lists, salary and documents before your employer applies; our guide for foreign applicants covers the basics.
- A permit can lead to long-term residence. Holders of a Critical Skills permit, and General Employment Permit holders after a qualifying period, can apply to move to Stamp 4.
How We Compiled These Figures
We downloaded DETE’s 2026 and 2025 spreadsheets (nationality, county, sector and company tables) from the official statistics pages listed below and summed them without adjustment. The nationality, county and sector tables for 2026 each total 33,362 permits issued, and the 2025 sector table totals 25,715 for January to October. Figures count permits, not people: one person can hold more than one permit over time, for example after changing employer. Percentages, shares and refusal rates are our calculations and are labelled as such. Read more in our editorial policy. If you spot an error, tell us through the contact page and we will correct it.
Frequently Asked Questions
How many work permits has Ireland issued in 2026? DETE issued 33,362 employment permits from January to October 2026, according to its statistics published on 9 November 2026.
Which nationality gets the most Irish work permits? India, with 10,275 permits in January to October 2026, followed by the Philippines (4,937) and Brazil (3,965).
What is the Irish work permit refusal rate? DETE refused 3,758 applications and issued 33,362 permits from January to October 2026. By our calculation, that is a refusal rate of about 10.1%, almost the same as 2025 (10.0%).
Which sector gets the most work permits in Ireland? Health and social work, with 8,900 permits in January to October 2026, more than double the next sector, accommodation and food services (3,421).
Is the number of Irish work permits rising? Yes. January to October 2026 is about 30% higher than the same months of 2025, and it already exceeds the full-year 2025 total of 31,044.
How often is this data updated? DETE updates its current-year tables monthly, covering permits up to the end of the previous month. We will update this page when new monthly figures are published.
Related Guides
- Companies That Received Irish Employment Permits
- Jobs in Ireland With Visa Sponsorship
- Critical Skills Employment Permit Ireland
- General Employment Permit Ireland
- Jobs in Ireland for Indians
- Jobs in Ireland for Pakistani Applicants
- Stamp 4 Ireland
Official Sources
- DETE: Employment permit statistics 2026 (nationality, county, sector and company tables for January to October 2026; published 9 November 2026)
- DETE: Employment permit statistics 2025 (full-year 2025 tables)
- EMN Ireland (ESRI): 2024 statistics on employment permits released (2024 issued and refused totals)
- DETE: Employment permit statistics overview
Get an email when Ireland's permit rules change
Salary thresholds, occupation lists and visa rules change every year. Subscribe and we will tell you when they do, plus new job guides. Free, no spam.
Subscribe free